QML图库中的图表
使用qml演示如何使用不同类型的图表。
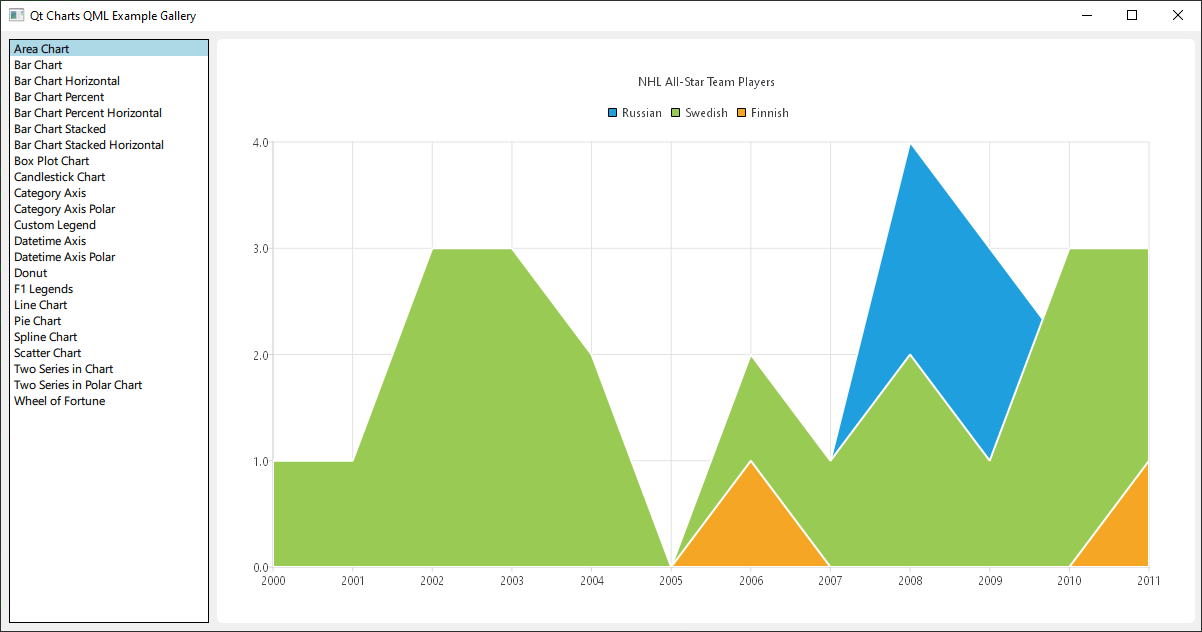
运行示例
要从Qt Creator运行示例,请打开欢迎模式并从示例中选择示例。有关更多信息,请访问构建和运行示例。
这是一个Qt Quick应用,每种图表类型的文件都位于示例文件夹的qml目录中,并按顺序由位于此示例目录中的main.qml加载到ListView中。
本文档不会关注顶级布局或加载,而是关注Qt Charts QML API的使用。
包含依赖项
所有.qml文件都以
import QtQuick
import QtCharts
使用QML创建图表
创建每种图表类型开始于创建一个ChartView。
要创建饼图,我们使用PieSeries API和几个PieSlices
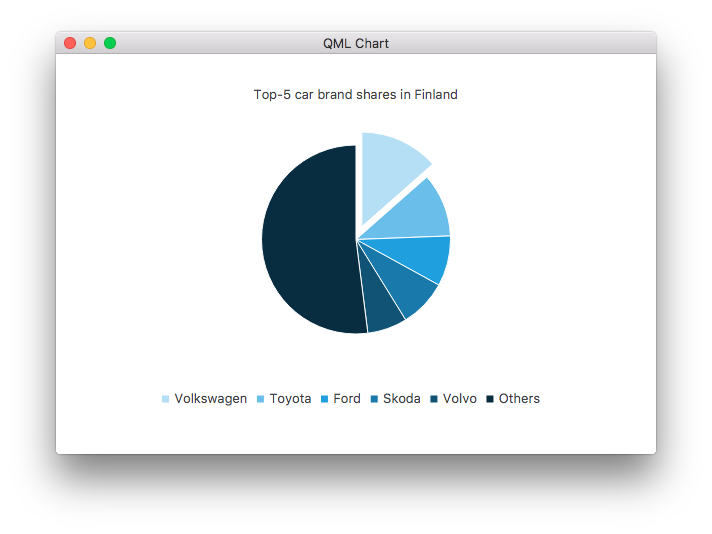
ChartView {
    id: chart
    title: "Top-5 car brand shares in Finland"
    anchors.fill: parent
    legend.alignment: Qt.AlignBottom
    antialiasing: true

    property variant othersSlice: 0

    PieSeries {
        id: pieSeries
        PieSlice { label: "Volkswagen"; value: 13.5 }
        PieSlice { label: "Toyota"; value: 10.9 }
        PieSlice { label: "Ford"; value: 8.6 }
        PieSlice { label: "Skoda"; value: 8.2 }
        PieSlice { label: "Volvo"; value: 6.8 }
    }

    Component.onCompleted: {
        // You can also manipulate slices dynamically, like append a slice or set a slice exploded
        othersSlice = pieSeries.append("Others", 52.0);
        pieSeries.find("Volkswagen").exploded = true;
    }
}
您可以使用线系列创建图表
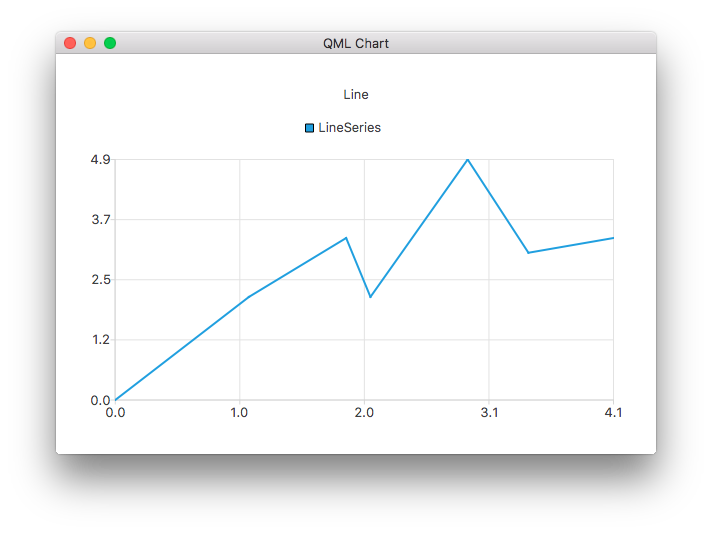
ChartView {
    title: "Line Chart"
    anchors.fill: parent
    antialiasing: true

    LineSeries {
        name: "Line"
        XYPoint { x: 0; y: 0 }
        XYPoint { x: 1.1; y: 2.1 }
        XYPoint { x: 1.9; y: 3.3 }
        XYPoint { x: 2.1; y: 2.1 }
        XYPoint { x: 2.9; y: 4.9 }
        XYPoint { x: 3.4; y: 3.0 }
        XYPoint { x: 4.1; y: 3.3 }
    }
}
和使用样条曲线系列
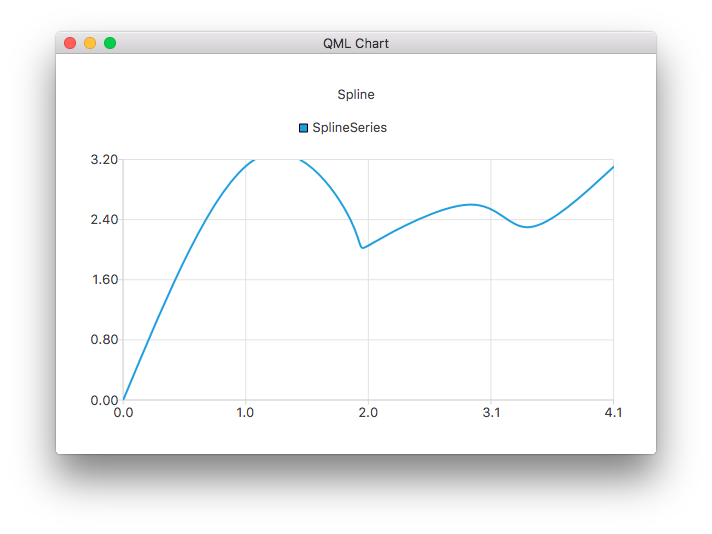
ChartView {
    title: "Spline Chart"
    anchors.fill: parent
    antialiasing: true

    SplineSeries {
        name: "Spline"
        XYPoint { x: 0; y: 0.0 }
        XYPoint { x: 1.1; y: 3.2 }
        XYPoint { x: 1.9; y: 2.4 }
        XYPoint { x: 2.1; y: 2.1 }
        XYPoint { x: 2.9; y: 2.6 }
        XYPoint { x: 3.4; y: 2.3 }
        XYPoint { x: 4.1; y: 3.1 }
    }
}
您可以使用三个面积系列创建一个演示NHL全明星球员选择的图表
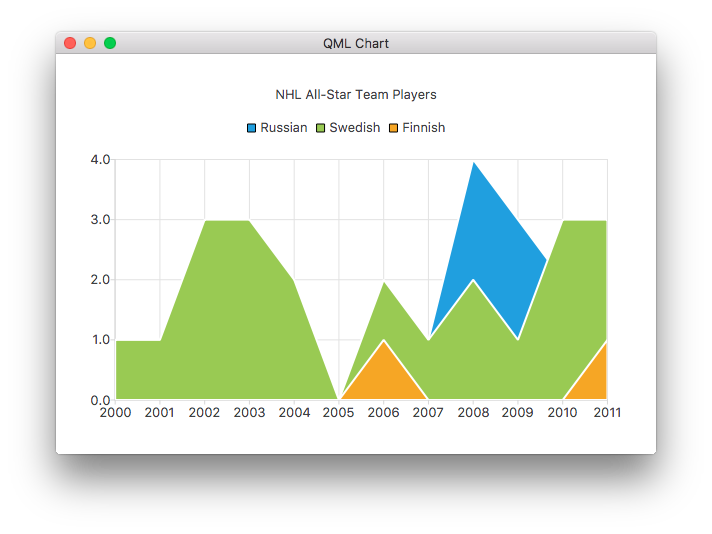
ChartView {
    title: "NHL All-Star Team Players"
    anchors.fill: parent
    antialiasing: true

    // Define x-axis to be used with the series instead of default one
    ValueAxis {
        id: valueAxis
        min: 2000
        max: 2011
        tickCount: 12
        labelFormat: "%.0f"
    }

    AreaSeries {
        name: "Russian"
        axisX: valueAxis
        upperSeries: LineSeries {
            XYPoint { x: 2000; y: 1 }
            XYPoint { x: 2001; y: 1 }
            XYPoint { x: 2002; y: 1 }
            XYPoint { x: 2003; y: 1 }
            XYPoint { x: 2004; y: 1 }
            XYPoint { x: 2005; y: 0 }
            XYPoint { x: 2006; y: 1 }
            XYPoint { x: 2007; y: 1 }
            XYPoint { x: 2008; y: 4 }
            XYPoint { x: 2009; y: 3 }
            XYPoint { x: 2010; y: 2 }
            XYPoint { x: 2011; y: 1 }
        }
    }
    ...
然后是一些散点系列
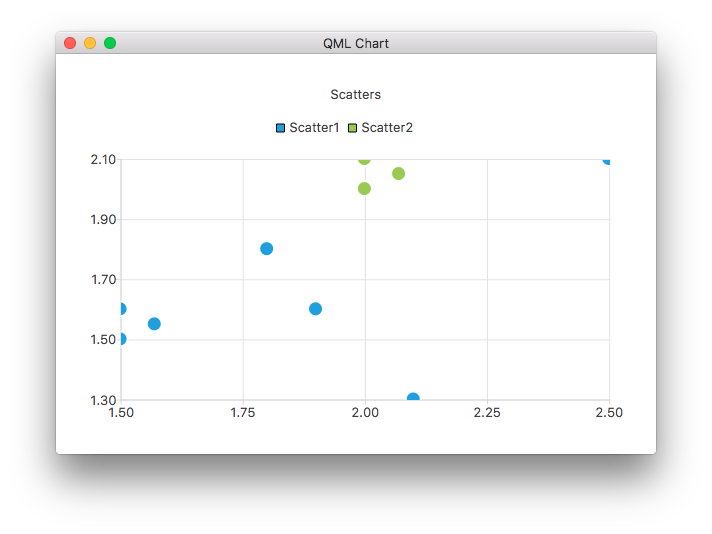
ChartView {
    title: "Scatter Chart"
    anchors.fill: parent
    antialiasing: true

    ScatterSeries {
        id: scatter1
        name: "Scatter A"
        XYPoint { x: 1.5; y: 1.5 }
        XYPoint { x: 1.5; y: 1.6 }
        XYPoint { x: 1.57; y: 1.55 }
        XYPoint { x: 1.8; y: 1.8 }
        XYPoint { x: 1.9; y: 1.6 }
        XYPoint { x: 2.1; y: 1.3 }
        XYPoint { x: 2.5; y: 2.1 }
    }

    ScatterSeries {
        name: "Scatter B"
        XYPoint { x: 2.0; y: 2.0 }
        XYPoint { x: 2.0; y: 2.1 }
        XYPoint { x: 2.07; y: 2.05 }
        XYPoint { x: 2.2; y: 2.9 }
        XYPoint { x: 2.4; y: 2.7 }
        XYPoint { x: 2.67; y: 2.65 }
    }
}
    ...
和几个不同的条形系列
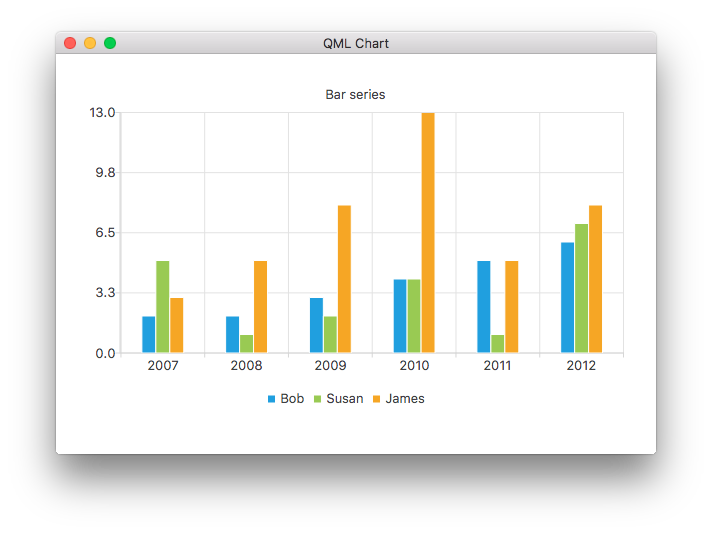
ChartView {
    title: "Bar Chart"
    anchors.fill: parent
    legend.alignment: Qt.AlignBottom
    antialiasing: true

    BarSeries {
        id: mySeries
        axisX: BarCategoryAxis { categories: ["2007", "2008", "2009", "2010", "2011", "2012" ] }
        BarSet { label: "Bob"; values: [2, 2, 3, 4, 5, 6] }
        BarSet { label: "Susan"; values: [5, 1, 2, 4, 1, 7] }
        BarSet { label: "James"; values: [3, 5, 8, 13, 5, 8] }
    }
}
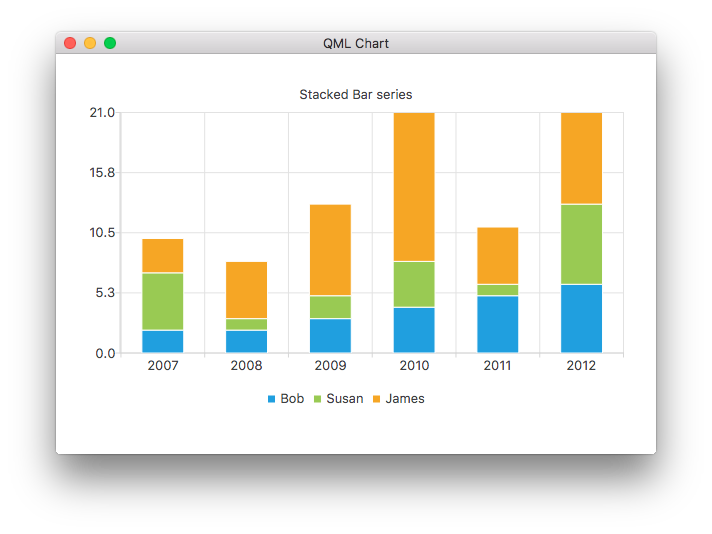
ChartView {
    title: "Stacked Bar Chart"
    anchors.fill: parent
    legend.alignment: Qt.AlignBottom
    antialiasing: true

    StackedBarSeries {
        axisX: BarCategoryAxis { categories: ["2007", "2008", "2009", "2010", "2011", "2012" ] }
        BarSet { label: "Bob"; values: [2, 2, 3, 4, 5, 6] }
        BarSet { label: "Susan"; values: [5, 1, 2, 4, 1, 7] }
        BarSet { label: "James"; values: [3, 5, 8, 13, 5, 8] }
    }
}
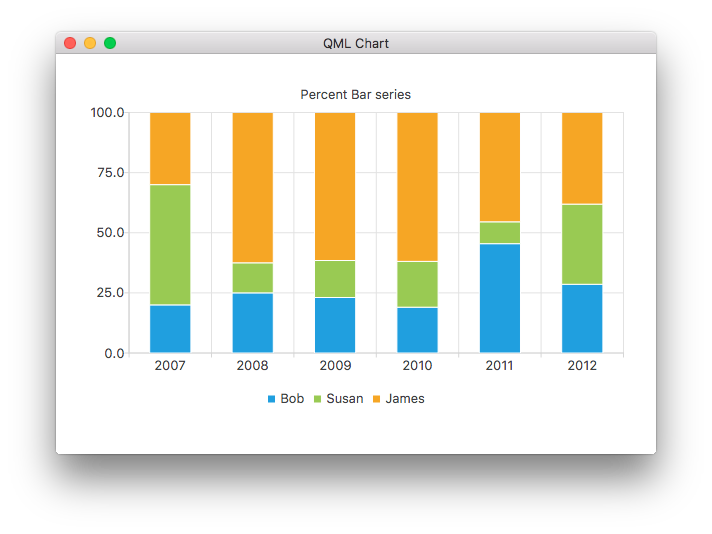
ChartView {
    title: "Percent Bar Chart"
    anchors.fill: parent
    legend.alignment: Qt.AlignBottom
    antialiasing: true

    PercentBarSeries {
        axisX: BarCategoryAxis { categories: ["2007", "2008", "2009", "2010", "2011", "2012" ] }
        BarSet { label: "Bob"; values: [2, 2, 3, 4, 5, 6] }
        BarSet { label: "Susan"; values: [5, 1, 2, 4, 1, 7] }
        BarSet { label: "James"; values: [3, 5, 8, 13, 5, 8] }
    }
}
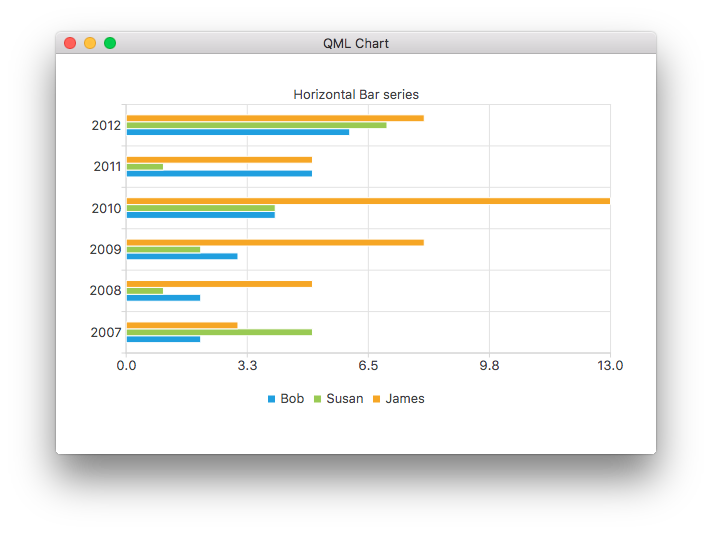
ChartView {
    title: "Horizontal Bar Chart"
    anchors.fill: parent
    legend.alignment: Qt.AlignBottom
    antialiasing: true

    HorizontalBarSeries {
        axisY: BarCategoryAxis { categories: ["2007", "2008", "2009", "2010", "2011", "2012" ] }
        BarSet { label: "Bob"; values: [2, 2, 3, 4, 5, 6] }
        BarSet { label: "Susan"; values: [5, 1, 2, 4, 1, 7] }
        BarSet { label: "James"; values: [3, 5, 8, 13, 5, 8] }
    }
}
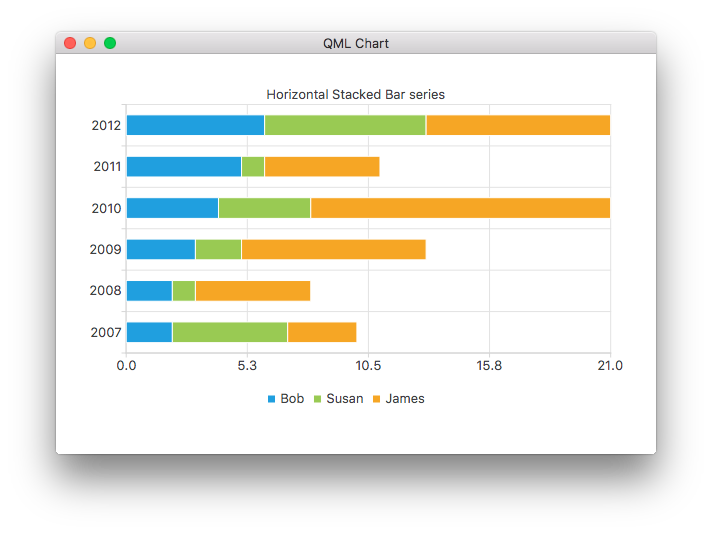
ChartView {
    title: "Horizontal Stacked Bar Chart"
    anchors.fill: parent
    legend.alignment: Qt.AlignBottom
    antialiasing: true

    HorizontalStackedBarSeries {
        axisY: BarCategoryAxis { categories: ["2007", "2008", "2009", "2010", "2011", "2012" ] }
        BarSet { label: "Bob"; values: [2, 2, 3, 4, 5, 6] }
        BarSet { label: "Susan"; values: [5, 1, 2, 4, 1, 7] }
        BarSet { label: "James"; values: [3, 5, 8, 13, 5, 8] }
    }
}
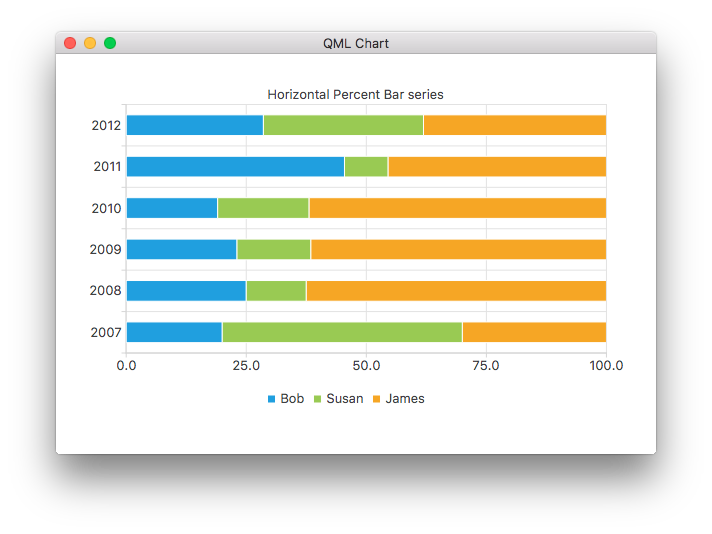
ChartView {
    title: "Horizontal Percent Bar Chart"
    anchors.fill: parent
    legend.alignment: Qt.AlignBottom
    antialiasing: true

    HorizontalPercentBarSeries {
        axisY: BarCategoryAxis { categories: ["2007", "2008", "2009", "2010", "2011", "2012" ] }
        BarSet { label: "Bob"; values: [2, 2, 3, 4, 5, 6] }
        BarSet { label: "Susan"; values: [5, 1, 2, 4, 1, 7] }
        BarSet { label: "James"; values: [3, 5, 8, 13, 5, 8] }
    }
}
这演示了如何使用两个饼图系列创建饼图
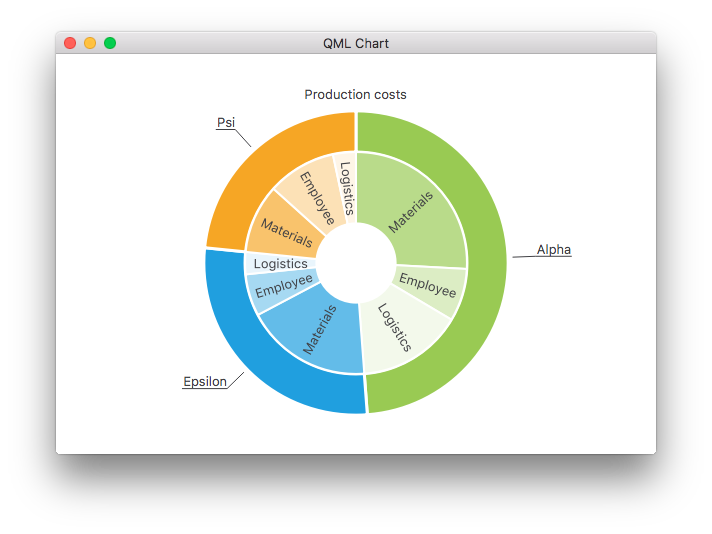
ChartView {
    id: chart
    title: "Production Costs"
    anchors.fill: parent
    legend.visible: false
    antialiasing: true

    PieSeries {
        id: pieOuter
        size: 0.96
        holeSize: 0.7
        PieSlice { id: slice; label: "Alpha"; value: 19511; color: "#99CA53" }
        PieSlice { label: "Epsilon"; value: 11105; color: "#209FDF" }
        PieSlice { label: "Psi"; value: 9352; color: "#F6A625" }
    }

    PieSeries {
        size: 0.7
        id: pieInner
        holeSize: 0.25

        PieSlice { label: "Materials"; value: 10334; color: "#B9DB8A" }
        PieSlice { label: "Employee"; value: 3066; color: "#DCEDC4" }
        PieSlice { label: "Logistics"; value: 6111; color: "#F3F9EB" }

        PieSlice { label: "Materials"; value: 7371; color: "#63BCE9" }
        PieSlice { label: "Employee"; value: 2443; color: "#A6D9F2" }
        PieSlice { label: "Logistics"; value: 1291; color: "#E9F5FC" }

        PieSlice { label: "Materials"; value: 4022; color: "#F9C36C" }
        PieSlice { label: "Employee"; value: 3998; color: "#FCE1B6" }
        PieSlice { label: "Logistics"; value: 1332; color: "#FEF5E7" }
    }

    Component.onCompleted: {
        // Set the common slice properties dynamically for convenience
        for (var i = 0; i < pieOuter.count; i++) {
            pieOuter.at(i).labelPosition = PieSlice.LabelOutside;
            pieOuter.at(i).labelVisible = true;
            pieOuter.at(i).borderWidth = 3;
        }
        for (var i = 0; i < pieInner.count; i++) {
            pieInner.at(i).labelPosition = PieSlice.LabelInsideNormal;
            pieInner.at(i).labelVisible = true;
            pieInner.at(i).borderWidth = 2;
        }
    }
}
此外,在Qt Quick 2中,通过qml属性设置抗锯齿。
更多图表
有关此示例应用中剩余图表的介绍,请参阅以下链接。
告诉你如何自定义ChartView和系列的不同视觉属性。 | |
告诉你如何创建自己的自定义图例。 | |
演示如何在你的QML应用中使用坐标轴。 | |
实现一个F1传奇图表,以演示列表模型作为数据源。 | |
演示如何在你的QML应用程序中创建几个不同的极坐标图表。 |
© 2024 Qt公司有限。本文件的文档贡献是各自所有者的版权。本文件提供的文档是根据由自由软件基金会发布的GNU自由文档许可证版本1.3的条款许可的。Qt及其相关标志是芬兰和/或其他国家的The Qt Company Ltd.的商标。所有其他商标均为其各自所有者的财产。
