自定义图例
注意: 这是《带有 QML 画廊的图表》示例的一部分。
在这里,我们向您展示如何创建自己的自定义图例,而不是使用 ChartView API 的内置图例。
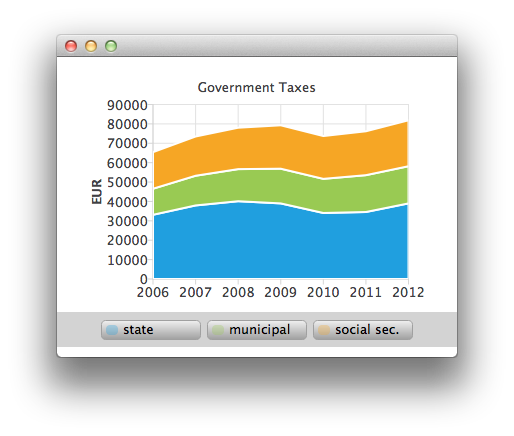
应用程序的主要视图显示一个堆叠区域图。这是创建其中一个堆叠区域的方式。参见 ChartViewStacked.qml 和 AnimatedAreaSeries.qml。

AnimatedAreaSeries {
    id: municipalSeries
    name: "municipal"
    axisX: axisX
    axisY: axisY
    borderWidth: 0
    upperSeries: LineSeries {
        id: municipalUpper
        XYPoint { x: 2006; y: 33119 + 13443 }
        XYPoint { x: 2007; y: 37941 + 15311 }
        XYPoint { x: 2008; y: 40122 + 16552 }
        XYPoint { x: 2009; y: 38991 + 17904 }
        XYPoint { x: 2010; y: 34055 + 17599 }
        XYPoint { x: 2011; y: 34555 + 19002 }
        XYPoint { x: 2012; y: 38991 + 19177 }
    }
    lowerSeries: stateUpper
}
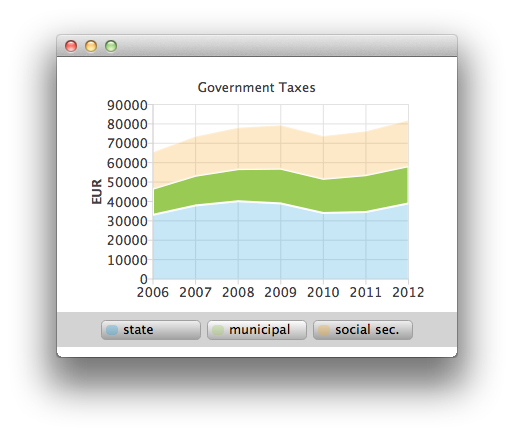
将鼠标悬停在图例上方可突出显示悬停的序列。(参见 CustomLegend.qml)。

Row {
    id: legendRow
    anchors.centerIn: parent
    spacing: 10

    Repeater {
        id: legendRepeater
        model: legend.seriesCount
        delegate: legendDelegate
    }
}
Component {
    id: legendDelegate
    Rectangle {
        id: rect
    ...
        MouseArea {
            id: mouseArea
            anchors.fill: parent
            hoverEnabled: true
            onEntered: {
                rect.gradient = buttonGradientHovered;
                legend.entered(label.text);
            }
            onExited: {
                rect.gradient = buttonGradient;
                legend.exited(label.text);
                marker.opacity = 0.3;
                marker.height = 10;
            }
            onClicked: {
                legend.selected(label.text);
                marker.opacity = 1.0;
                marker.height = 12;
            }
        }
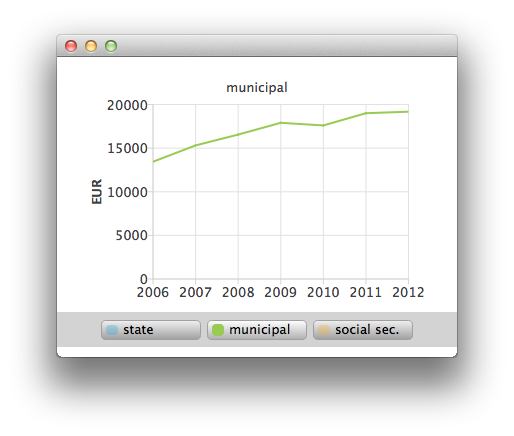
您还可以通过鼠标点击选择其中一个堆叠区域,以更详细地查看作为线序列的堆叠区域(参见 ChartViewHighlighted.qml)。

ChartView {
    id: chartViewHighlighted

    property variant selectedSeries

    signal clicked

    legend.visible: false
    margins.top: 10
    margins.bottom: 0
    antialiasing: true

    LineSeries {
        id: lineSeries

        axisX: ValueAxis {
            min: 2006
            max: 2012
            labelFormat: "%.0f"
            tickCount: 7
        }
        axisY: ValueAxis {
            id: axisY
            titleText: "EUR"
            min: 0
            max: 40000
            labelFormat: "%.0f"
            tickCount: 5
        }
    }
© 2024 The Qt Company Ltd。本文档中的贡献包括各自所有者的版权。本提供的文档根据自由软件基金会发布的 GNU 自由文档许可协议版本 1.3 许可。Qt 及其相应标志为芬兰的 The Qt Company Ltd. 及/或世界其他国家的商标。所有其他商标属于其各自所有者。
