使用 QML 与极坐标图
注意:这是具有 QML 的图表库 示例的一部分。
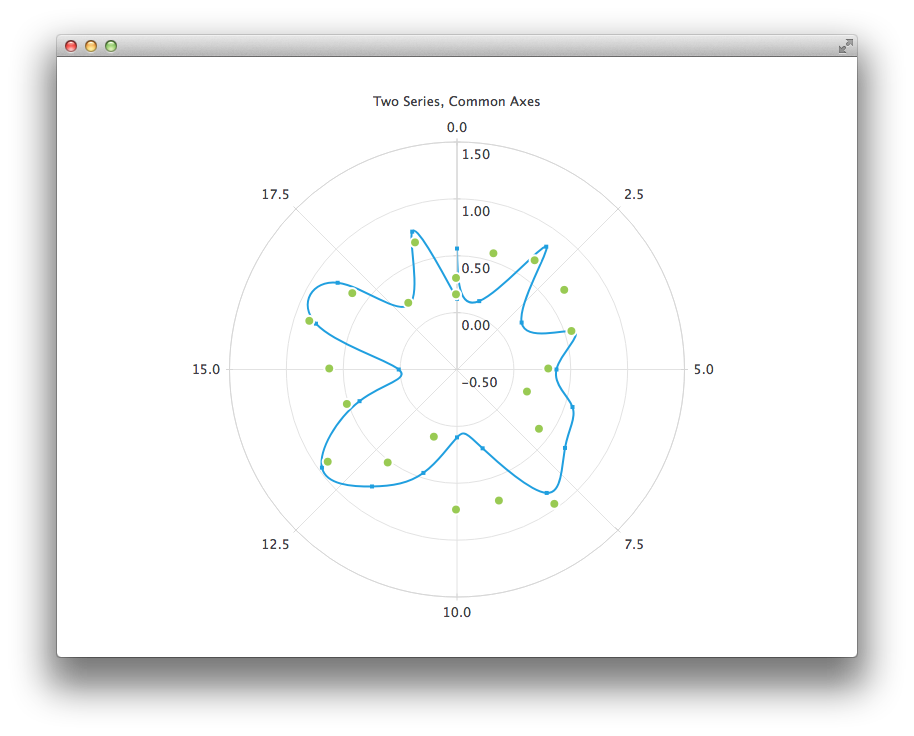
我们从一个包含折线系列和随机数据散点系列的图表开始。两个系列使用相同的轴。

PolarChartView {
    title: "Two Series, Common Axes"
    anchors.fill: parent
    legend.visible: false
    antialiasing: true

    ValueAxis {
        id: axisAngular
        min: 0
        max: 20
        tickCount: 9
    }

    ValueAxis {
        id: axisRadial
        min: -0.5
        max: 1.5
    }

    SplineSeries {
        id: series1
        axisAngular: axisAngular
        axisRadial: axisRadial
        pointsVisible: true
    }

    ScatterSeries {
        id: series2
        axisAngular: axisAngular
        axisRadial: axisRadial
        markerSize: 10
    }

    // Add data dynamically to the series
    Component.onCompleted: {
        for (var i = 0; i <= 20; i++) {
            series1.append(i, Math.random());
            series2.append(i, Math.random());
        }
    }
}
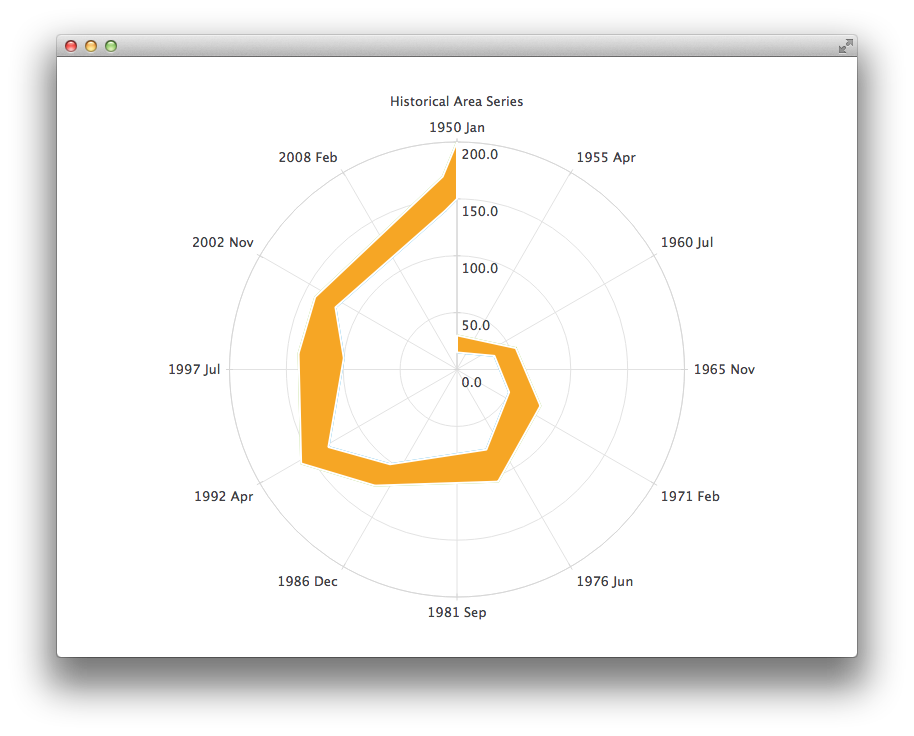
下一个图表显示了一些需要使用DateTimeAxis和AreaSeries的精确历史数据。

PolarChartView {
    id: root
    title: "Historical Area Chart"
    anchors.fill: parent
    legend.visible: false
    antialiasing: true

    DateTimeAxis {
        id: axis1
        format: "yyyy MMM"
        tickCount: 13
    }
    ValueAxis {
        id: axis2
    }
    LineSeries {
        id: lowerLine
        axisAngular: axis1
        axisRadial: axis2

        // Please note that month in JavaScript months are zero based, so 2 means March
        XYPoint { x: root.toMsecsSinceEpoch(new Date(1950, 0, 1)); y: 15 }
        XYPoint { x: root.toMsecsSinceEpoch(new Date(1962, 4, 1)); y: 35 }
        XYPoint { x: root.toMsecsSinceEpoch(new Date(1970, 0, 1)); y: 50 }
        XYPoint { x: root.toMsecsSinceEpoch(new Date(1978, 2, 1)); y: 75 }
        XYPoint { x: root.toMsecsSinceEpoch(new Date(1987, 11, 1)); y: 102 }
        XYPoint { x: root.toMsecsSinceEpoch(new Date(1992, 1, 1)); y: 132 }
        XYPoint { x: root.toMsecsSinceEpoch(new Date(1998, 7, 1)); y: 100 }
        XYPoint { x: root.toMsecsSinceEpoch(new Date(2002, 4, 1)); y: 120 }
        XYPoint { x: root.toMsecsSinceEpoch(new Date(2012, 8, 1)); y: 140 }
        XYPoint { x: root.toMsecsSinceEpoch(new Date(2013, 5, 1)); y: 150 }
    }
    LineSeries {
        id: upperLine
        axisAngular: axis1
        axisRadial: axis2

        // Please note that month in JavaScript months are zero based, so 2 means March
        XYPoint { x: root.toMsecsSinceEpoch(new Date(1950, 0, 1)); y: 30 }
        XYPoint { x: root.toMsecsSinceEpoch(new Date(1962, 4, 1)); y: 55 }
        XYPoint { x: root.toMsecsSinceEpoch(new Date(1970, 0, 1)); y: 80 }
        XYPoint { x: root.toMsecsSinceEpoch(new Date(1978, 2, 1)); y: 105 }
        XYPoint { x: root.toMsecsSinceEpoch(new Date(1987, 11, 1)); y: 125 }
        XYPoint { x: root.toMsecsSinceEpoch(new Date(1992, 1, 1)); y: 160 }
        XYPoint { x: root.toMsecsSinceEpoch(new Date(1998, 7, 1)); y: 140 }
        XYPoint { x: root.toMsecsSinceEpoch(new Date(2002, 4, 1)); y: 140 }
        XYPoint { x: root.toMsecsSinceEpoch(new Date(2012, 8, 1)); y: 170 }
        XYPoint { x: root.toMsecsSinceEpoch(new Date(2013, 5, 1)); y: 200 }
    }
    AreaSeries {
        axisAngular: axis1
        axisRadial: axis2
        lowerSeries: lowerLine
        upperSeries: upperLine
    }

    // DateTimeAxis is based on QDateTimes so we must convert our JavaScript dates to
    // milliseconds since epoch to make them match the DateTimeAxis values
    function toMsecsSinceEpoch(date) {
        var msecs = date.getTime();
        return msecs;
    }
}
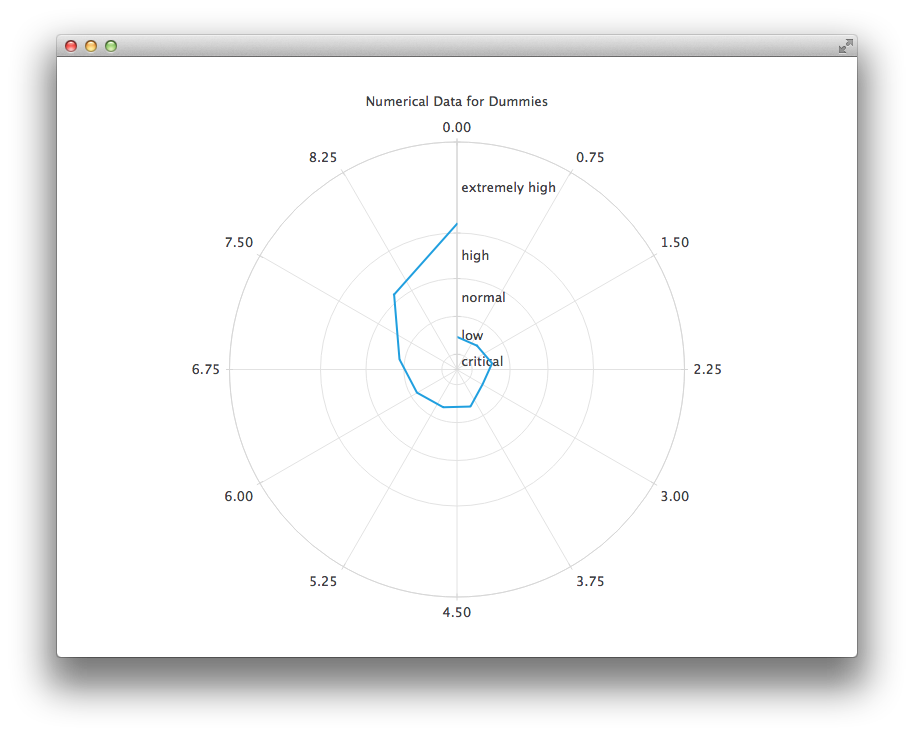
下一个图表使用CategoryAxis使数据更容易理解。

PolarChartView {
    title: "Numerical Data for Dummies"
    anchors.fill: parent
    legend.visible: false
    antialiasing: true

    LineSeries {
        axisRadial: CategoryAxis {
            min: 0
            max: 30
            CategoryRange {
                label: "critical"
                endValue: 2
            }
            CategoryRange {
                label: "low"
                endValue: 7
            }
            CategoryRange {
                label: "normal"
                endValue: 12
            }
            CategoryRange {
                label: "high"
                endValue: 18
            }
            CategoryRange {
                label: "extremely high"
                endValue: 30
            }
        }

        axisAngular: ValueAxis {
            tickCount: 13
        }

        XYPoint { x: 0; y: 4.3 }
        XYPoint { x: 1; y: 4.1 }
        XYPoint { x: 2; y: 4.7 }
        XYPoint { x: 3; y: 3.9 }
        XYPoint { x: 4; y: 5.2 }
        XYPoint { x: 5; y: 5.3 }
        XYPoint { x: 6; y: 6.1 }
        XYPoint { x: 7; y: 7.7 }
        XYPoint { x: 8; y: 12.9 }
        XYPoint { x: 9; y: 19.2 }
    }
}
© 2024 Qt 公司有限公司。本文件中包含的文档贡献均属于其各自的版权所有者。本文件中的文档根据自由软件基金会发布的GNU 自由文档许可版本 1.3 的条款进行许可。Qt 及其相应标志是芬兰以及/或世界其他国家的 Qt 公司有限公司的商标。所有其他商标均为其各自所有者的财产。
