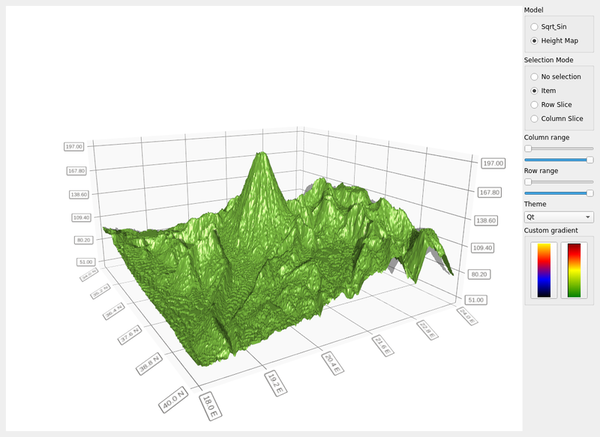
表面示例#
在一个小部件应用程序中使用 Q3DSurface。
表面示例展示了如何使用 Q3DSurface 创建简单的 3D 表面图,并结合使用小部件来调整多个可调整的特性。它需要构建带 --pyside-numpy-support 选项的 PySide6。本例演示以下特性
如何从二维numpy数组设置 QSurfaceDataProxy。
如何使用 QHeightMapSurfaceDataProxy 显示 3D 高程图。
用于研究图形的三种不同选择模式。
轴范围的使用,以显示图形选定的部分。
更改主题。
如何自定义表面渐变。
有关如何与图形交互的说明,请参阅此页面。

# Copyright (C) 2022 The Qt Company Ltd.
# SPDX-License-Identifier: LicenseRef-Qt-Commercial OR BSD-3-Clause

import sys

from PySide6.QtCore import QSize, Qt
from PySide6.QtDataVisualization import Q3DSurface
from PySide6.QtGui import QBrush, QIcon, QLinearGradient, QPainter, QPixmap
from PySide6.QtWidgets import (QApplication, QComboBox, QGroupBox, QHBoxLayout,
                               QLabel, QMessageBox, QPushButton, QRadioButton,
                               QSizePolicy, QSlider, QVBoxLayout, QWidget)

from surfacegraph import SurfaceGraph

THEMES = ["Qt", "Primary Colors", "Digia", "Stone Moss", "Army Blue", "Retro",
          "Ebony", "Isabelle"]


class Window(QWidget):
    def __init__(self, graph, parent=None):
        super().__init__(parent)
        self._graph = graph
        self._container = QWidget.createWindowContainer(self._graph, self,
                                                        Qt.Widget)

        screen_size = self._graph.screen().size()
        self._container.setMinimumSize(QSize(screen_size.width() / 2,
                                       screen_size.height() / 1.6))
        self._container.setMaximumSize(screen_size)
        self._container.setSizePolicy(QSizePolicy.Expanding,
                                      QSizePolicy.Expanding)
        self._container.setFocusPolicy(Qt.StrongFocus)

        h_layout = QHBoxLayout(self)
        v_layout = QVBoxLayout()
        h_layout.addWidget(self._container, 1)
        h_layout.addLayout(v_layout)
        v_layout.setAlignment(Qt.AlignTop)

        model_group_box = QGroupBox("Model")

        sqrt_sin_model_rb = QRadioButton(self)
        sqrt_sin_model_rb.setText("Sqrt& Sin")
        sqrt_sin_model_rb.setChecked(False)

        height_map_model_rb = QRadioButton(self)
        height_map_model_rb.setText("Height Map")
        height_map_model_rb.setChecked(False)

        model_vbox = QVBoxLayout()
        model_vbox.addWidget(sqrt_sin_model_rb)
        model_vbox.addWidget(height_map_model_rb)
        model_group_box.setLayout(model_vbox)

        selection_group_box = QGroupBox("Selection Mode")

        mode_none_rb = QRadioButton(self)
        mode_none_rb.setText("No selection")
        mode_none_rb.setChecked(False)

        mode_item_rb = QRadioButton(self)
        mode_item_rb.setText("Item")
        mode_item_rb.setChecked(False)

        mode_slice_row_rb = QRadioButton(self)
        mode_slice_row_rb.setText("Row Slice")
        mode_slice_row_rb.setChecked(False)

        mode_slice_column_rb = QRadioButton(self)
        mode_slice_column_rb.setText("Column Slice")
        mode_slice_column_rb.setChecked(False)

        selection_vbox = QVBoxLayout()
        selection_vbox.addWidget(mode_none_rb)
        selection_vbox.addWidget(mode_item_rb)
        selection_vbox.addWidget(mode_slice_row_rb)
        selection_vbox.addWidget(mode_slice_column_rb)
        selection_group_box.setLayout(selection_vbox)

        axis_min_slider_x = QSlider(Qt.Horizontal, self)
        axis_min_slider_x.setMinimum(0)
        axis_min_slider_x.setTickInterval(1)
        axis_min_slider_x.setEnabled(True)
        axis_max_slider_x = QSlider(Qt.Horizontal, self)
        axis_max_slider_x.setMinimum(1)
        axis_max_slider_x.setTickInterval(1)
        axis_max_slider_x.setEnabled(True)
        axis_min_slider_z = QSlider(Qt.Horizontal, self)
        axis_min_slider_z.setMinimum(0)
        axis_min_slider_z.setTickInterval(1)
        axis_min_slider_z.setEnabled(True)
        axis_max_slider_z = QSlider(Qt.Horizontal, self)
        axis_max_slider_z.setMinimum(1)
        axis_max_slider_z.setTickInterval(1)
        axis_max_slider_z.setEnabled(True)

        theme_list = QComboBox(self)
        theme_list.addItems(THEMES)

        color_group_box = QGroupBox("Custom gradient")

        gr_bto_y = QLinearGradient(0, 0, 1, 100)
        gr_bto_y.setColorAt(1.0, Qt.black)
        gr_bto_y.setColorAt(0.67, Qt.blue)
        gr_bto_y.setColorAt(0.33, Qt.red)
        gr_bto_y.setColorAt(0.0, Qt.yellow)

        pm = QPixmap(24, 100)
        pmp = QPainter(pm)
        pmp.setBrush(QBrush(gr_bto_y))
        pmp.setPen(Qt.NoPen)
        pmp.drawRect(0, 0, 24, 100)
        pmp.end()

        gradient_bto_ypb = QPushButton(self)
        gradient_bto_ypb.setIcon(QIcon(pm))
        gradient_bto_ypb.setIconSize(QSize(24, 100))

        gr_gto_r = QLinearGradient(0, 0, 1, 100)
        gr_gto_r.setColorAt(1.0, Qt.darkGreen)
        gr_gto_r.setColorAt(0.5, Qt.yellow)
        gr_gto_r.setColorAt(0.2, Qt.red)
        gr_gto_r.setColorAt(0.0, Qt.darkRed)
        pmp.begin(pm)
        pmp.setBrush(QBrush(gr_gto_r))
        pmp.drawRect(0, 0, 24, 100)
        pmp.end()

        gradient_gto_rpb = QPushButton(self)
        gradient_gto_rpb.setIcon(QIcon(pm))
        gradient_gto_rpb.setIconSize(QSize(24, 100))

        color_hbox = QHBoxLayout()
        color_hbox.addWidget(gradient_bto_ypb)
        color_hbox.addWidget(gradient_gto_rpb)
        color_group_box.setLayout(color_hbox)

        v_layout.addWidget(model_group_box)
        v_layout.addWidget(selection_group_box)
        v_layout.addWidget(QLabel("Column range"))
        v_layout.addWidget(axis_min_slider_x)
        v_layout.addWidget(axis_max_slider_x)
        v_layout.addWidget(QLabel("Row range"))
        v_layout.addWidget(axis_min_slider_z)
        v_layout.addWidget(axis_max_slider_z)
        v_layout.addWidget(QLabel("Theme"))
        v_layout.addWidget(theme_list)
        v_layout.addWidget(color_group_box)

        self._modifier = SurfaceGraph(self._graph)

        height_map_model_rb.toggled.connect(self._modifier.enable_height_map_model)
        sqrt_sin_model_rb.toggled.connect(self._modifier.enable_sqrt_sin_model)
        mode_none_rb.toggled.connect(self._modifier.toggle_mode_none)
        mode_item_rb.toggled.connect(self._modifier.toggle_mode_item)
        mode_slice_row_rb.toggled.connect(self._modifier.toggle_mode_slice_row)
        mode_slice_column_rb.toggled.connect(self._modifier.toggle_mode_slice_column)
        axis_min_slider_x.valueChanged.connect(self._modifier.adjust_xmin)
        axis_max_slider_x.valueChanged.connect(self._modifier.adjust_xmax)
        axis_min_slider_z.valueChanged.connect(self._modifier.adjust_zmin)
        axis_max_slider_z.valueChanged.connect(self._modifier.adjust_zmax)
        theme_list.currentIndexChanged[int].connect(self._modifier.change_theme)
        gradient_bto_ypb.pressed.connect(self._modifier.set_black_to_yellow_gradient)
        gradient_gto_rpb.pressed.connect(self._modifier.set_green_to_red_gradient)

        self._modifier.set_axis_min_slider_x(axis_min_slider_x)
        self._modifier.set_axis_max_slider_x(axis_max_slider_x)
        self._modifier.set_axis_min_slider_z(axis_min_slider_z)
        self._modifier.set_axis_max_slider_z(axis_max_slider_z)

        sqrt_sin_model_rb.setChecked(True)
        mode_item_rb.setChecked(True)
        theme_list.setCurrentIndex(2)


if __name__ == "__main__":
    app = QApplication(sys.argv)
    graph = Q3DSurface()
    if not graph.hasContext():
        msg_box = QMessageBox()
        msg_box.setText("Couldn't initialize the OpenGL context.")
        msg_box.exec()
        sys.exit(-1)

    window = Window(graph)
    window.setWindowTitle("Surface example")
    window.show()

    sys.exit(app.exec())
# Copyright (C) 2022 The Qt Company Ltd.
# SPDX-License-Identifier: LicenseRef-Qt-Commercial OR BSD-3-Clause

import numpy as np
import math
from pathlib import Path

from PySide6.QtCore import (QObject, Qt, Slot)
from PySide6.QtDataVisualization import (Q3DTheme, QAbstract3DGraph,
                                         QHeightMapSurfaceDataProxy,
                                         QSurface3DSeries,
                                         QSurfaceDataProxy,
                                         QValue3DAxis)
from PySide6.QtGui import QImage, QLinearGradient
from PySide6.QtWidgets import QSlider

SAMPLE_COUNT_X = 50
SAMPLE_COUNT_Z = 50
HEIGHT_MAP_GRID_STEP_X = 6
HEIGHT_MAP_GRID_STEP_Z = 6
SAMPLE_MIN = -8.0
SAMPLE_MAX = 8.0


def fill_proxy(p):
    stepX = (SAMPLE_MAX - SAMPLE_MIN) / float(SAMPLE_COUNT_X - 1)
    stepZ = (SAMPLE_MAX - SAMPLE_MIN) / float(SAMPLE_COUNT_Z - 1)
    data = np.zeros((SAMPLE_COUNT_Z, SAMPLE_COUNT_X))
    for i in range(SAMPLE_COUNT_Z):
        # Keep values within range bounds, since just adding step can cause
        # minor drift due to the rounding errors.
        z = min(SAMPLE_MAX, (i * stepZ + SAMPLE_MIN))
        for j in range(SAMPLE_COUNT_X):
            x = min(SAMPLE_MAX, (j * stepX + SAMPLE_MIN))
            R = math.sqrt(z * z + x * x) + 0.01
            y = (math.sin(R) / R + 0.24) * 1.61
            data[i, j] = y
    p.resetArrayNp(SAMPLE_MIN, stepX, SAMPLE_MIN, stepZ, data)


class SurfaceGraph(QObject):
    def __init__(self, surface, parent=None):
        super().__init__(parent)

        self.m_graph = surface
        self.m_graph.setAxisX(QValue3DAxis())
        self.m_graph.setAxisY(QValue3DAxis())
        self.m_graph.setAxisZ(QValue3DAxis())

        self.m_sqrtSinProxy = QSurfaceDataProxy()
        fill_proxy(self.m_sqrtSinProxy)

        self.m_sqrtSinSeries = QSurface3DSeries(self.m_sqrtSinProxy)

        image_file = Path(__file__).parent.parent / "surface" / "mountain.png"
        height_map_image = QImage(image_file)
        self.m_heightMapProxy = QHeightMapSurfaceDataProxy(height_map_image)
        self.m_heightMapSeries = QSurface3DSeries(self.m_heightMapProxy)
        self.m_heightMapSeries.setItemLabelFormat("(@xLabel, @zLabel): @yLabel")
        self.m_heightMapProxy.setValueRanges(34.0, 40.0, 18.0, 24.0)

        self.m_heightMapWidth = height_map_image.width()
        self.m_heightMapHeight = height_map_image.height()

        self.m_axisMinSliderX = QSlider()
        self.m_axisMaxSliderX = QSlider()
        self.m_axisMinSliderZ = QSlider()
        self.m_axisMaxSliderZ = QSlider()
        self.m_rangeMinX = 0.0
        self.m_rangeMinZ = 0.0
        self.m_stepX = 0.0
        self.m_stepZ = 0.0

    @Slot(bool)
    def enable_sqrt_sin_model(self, enable):
        if enable:
            self.m_sqrtSinSeries.setDrawMode(QSurface3DSeries.DrawSurfaceAndWireframe)
            self.m_sqrtSinSeries.setFlatShadingEnabled(True)

            self.m_graph.axisX().setLabelFormat("%.2f")
            self.m_graph.axisZ().setLabelFormat("%.2f")
            self.m_graph.axisX().setRange(SAMPLE_MIN, SAMPLE_MAX)
            self.m_graph.axisY().setRange(0.0, 2.0)
            self.m_graph.axisZ().setRange(SAMPLE_MIN, SAMPLE_MAX)
            self.m_graph.axisX().setLabelAutoRotation(30)
            self.m_graph.axisY().setLabelAutoRotation(90)
            self.m_graph.axisZ().setLabelAutoRotation(30)

            self.m_graph.removeSeries(self.m_heightMapSeries)
            self.m_graph.addSeries(self.m_sqrtSinSeries)

            # Reset range sliders for Sqrt&Sin
            self.m_rangeMinX = SAMPLE_MIN
            self.m_rangeMinZ = SAMPLE_MIN
            self.m_stepX = (SAMPLE_MAX - SAMPLE_MIN) / float(SAMPLE_COUNT_X - 1)
            self.m_stepZ = (SAMPLE_MAX - SAMPLE_MIN) / float(SAMPLE_COUNT_Z - 1)
            self.m_axisMinSliderX.setMaximum(SAMPLE_COUNT_X - 2)
            self.m_axisMinSliderX.setValue(0)
            self.m_axisMaxSliderX.setMaximum(SAMPLE_COUNT_X - 1)
            self.m_axisMaxSliderX.setValue(SAMPLE_COUNT_X - 1)
            self.m_axisMinSliderZ.setMaximum(SAMPLE_COUNT_Z - 2)
            self.m_axisMinSliderZ.setValue(0)
            self.m_axisMaxSliderZ.setMaximum(SAMPLE_COUNT_Z - 1)
            self.m_axisMaxSliderZ.setValue(SAMPLE_COUNT_Z - 1)

    @Slot(bool)
    def enable_height_map_model(self, enable):
        if enable:
            self.m_heightMapSeries.setDrawMode(QSurface3DSeries.DrawSurface)
            self.m_heightMapSeries.setFlatShadingEnabled(False)

            self.m_graph.axisX().setLabelFormat("%.1f N")
            self.m_graph.axisZ().setLabelFormat("%.1f E")
            self.m_graph.axisX().setRange(34.0, 40.0)
            self.m_graph.axisY().setAutoAdjustRange(True)
            self.m_graph.axisZ().setRange(18.0, 24.0)

            self.m_graph.axisX().setTitle("Latitude")
            self.m_graph.axisY().setTitle("Height")
            self.m_graph.axisZ().setTitle("Longitude")

            self.m_graph.removeSeries(self.m_sqrtSinSeries)
            self.m_graph.addSeries(self.m_heightMapSeries)

            # Reset range sliders for height map
            map_grid_count_x = self.m_heightMapWidth / HEIGHT_MAP_GRID_STEP_X
            map_grid_count_z = self.m_heightMapHeight / HEIGHT_MAP_GRID_STEP_Z
            self.m_rangeMinX = 34.0
            self.m_rangeMinZ = 18.0
            self.m_stepX = 6.0 / float(map_grid_count_x - 1)
            self.m_stepZ = 6.0 / float(map_grid_count_z - 1)
            self.m_axisMinSliderX.setMaximum(map_grid_count_x - 2)
            self.m_axisMinSliderX.setValue(0)
            self.m_axisMaxSliderX.setMaximum(map_grid_count_x - 1)
            self.m_axisMaxSliderX.setValue(map_grid_count_x - 1)
            self.m_axisMinSliderZ.setMaximum(map_grid_count_z - 2)
            self.m_axisMinSliderZ.setValue(0)
            self.m_axisMaxSliderZ.setMaximum(map_grid_count_z - 1)
            self.m_axisMaxSliderZ.setValue(map_grid_count_z - 1)

    @Slot(int)
    def adjust_xmin(self, minimum):
        min_x = self.m_stepX * float(minimum) + self.m_rangeMinX

        maximum = self.m_axisMaxSliderX.value()
        if minimum >= maximum:
            maximum = minimum + 1
            self.m_axisMaxSliderX.setValue(maximum)
        max_x = self.m_stepX * maximum + self.m_rangeMinX

        self.set_axis_xrange(min_x, max_x)

    @Slot(int)
    def adjust_xmax(self, maximum):
        max_x = self.m_stepX * float(maximum) + self.m_rangeMinX

        minimum = self.m_axisMinSliderX.value()
        if maximum <= minimum:
            minimum = maximum - 1
            self.m_axisMinSliderX.setValue(minimum)
        min_x = self.m_stepX * minimum + self.m_rangeMinX

        self.set_axis_xrange(min_x, max_x)

    @Slot(int)
    def adjust_zmin(self, minimum):
        min_z = self.m_stepZ * float(minimum) + self.m_rangeMinZ

        maximum = self.m_axisMaxSliderZ.value()
        if minimum >= maximum:
            maximum = minimum + 1
            self.m_axisMaxSliderZ.setValue(maximum)
        max_z = self.m_stepZ * maximum + self.m_rangeMinZ

        self.set_axis_zrange(min_z, max_z)

    @Slot(int)
    def adjust_zmax(self, maximum):
        max_x = self.m_stepZ * float(maximum) + self.m_rangeMinZ

        minimum = self.m_axisMinSliderZ.value()
        if maximum <= minimum:
            minimum = maximum - 1
            self.m_axisMinSliderZ.setValue(minimum)
        min_x = self.m_stepZ * minimum + self.m_rangeMinZ

        self.set_axis_zrange(min_x, max_x)

    def set_axis_xrange(self, minimum, maximum):
        self.m_graph.axisX().setRange(minimum, maximum)

    def set_axis_zrange(self, minimum, maximum):
        self.m_graph.axisZ().setRange(minimum, maximum)

    @Slot(int)
    def change_theme(self, theme):
        self.m_graph.activeTheme().setType(Q3DTheme.Theme(theme))

    @Slot()
    def set_black_to_yellow_gradient(self):
        gr = QLinearGradient()
        gr.setColorAt(0.0, Qt.black)
        gr.setColorAt(0.33, Qt.blue)
        gr.setColorAt(0.67, Qt.red)
        gr.setColorAt(1.0, Qt.yellow)

        series = self.m_graph.seriesList()[0]
        series.setBaseGradient(gr)
        series.setColorStyle(Q3DTheme.ColorStyleRangeGradient)

    @Slot()
    def set_green_to_red_gradient(self):
        gr = QLinearGradient()
        gr.setColorAt(0.0, Qt.darkGreen)
        gr.setColorAt(0.5, Qt.yellow)
        gr.setColorAt(0.8, Qt.red)
        gr.setColorAt(1.0, Qt.darkRed)

        series = self.m_graph.seriesList()[0]
        series.setBaseGradient(gr)
        series.setColorStyle(Q3DTheme.ColorStyleRangeGradient)

    @Slot()
    def toggle_mode_none(self):
        self.m_graph.setSelectionMode(QAbstract3DGraph.SelectionNone)

    @Slot()
    def toggle_mode_item(self):
        self.m_graph.setSelectionMode(QAbstract3DGraph.SelectionItem)

    @Slot()
    def toggle_mode_slice_row(self):
        self.m_graph.setSelectionMode(
            QAbstract3DGraph.SelectionItemAndRow | QAbstract3DGraph.SelectionSlice
        )

    @Slot()
    def toggle_mode_slice_column(self):
        self.m_graph.setSelectionMode(
            QAbstract3DGraph.SelectionItemAndColumn | QAbstract3DGraph.SelectionSlice
        )

    def set_axis_min_slider_x(self, slider):
        self.m_axisMinSliderX = slider

    def set_axis_max_slider_x(self, slider):
        self.m_axisMaxSliderX = slider

    def set_axis_min_slider_z(self, slider):
        self.m_axisMinSliderZ = slider

    def set_axis_max_slider_z(self, slider):
        self.m_axisMaxSliderZ = slider