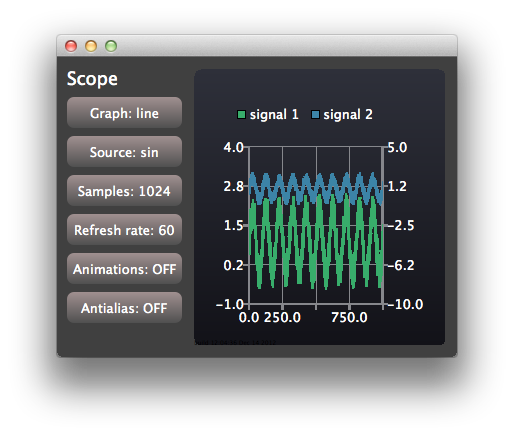
Qml示波器
该示例展示了如何使用Qt Charts QML API以严格性能要求实现应用程序。

示波器应用程序展示了如何使用Qt Charts QML API实现具有严格性能要求的应用程序。应用程序使用可配置特性的生成数据来模拟简单的示波器用户界面。
要获取有关应用程序输出控制台显示的实际渲染速度的信息,可以将QSG_RENDER_TIMING设置为1的您的运行环境设置。为此,请转到Qt Creator中的“项目 - 运行 - 运行环境”,并选择添加。然后您可以通过探索示例应用程序的不同可配置选项,以找到您环境中最好性能的配置。
运行示例
要从Qt Creator运行示例,请在欢迎模式下打开,然后从示例中选择示例。有关更多信息,请访问构建和运行示例。
创建视图
应用程序窗口由控制视图和作用域视图共享
Item {
    id: main
    width: 600
    height: 400

    ControlPanel {
        id: controlPanel
        anchors.top: parent.top
        anchors.topMargin: 10
        anchors.bottom: parent.bottom
        anchors.left: parent.left
        anchors.leftMargin: 10
    ...
    ScopeView {
        id: scopeView
        anchors.top: parent.top
        anchors.bottom: parent.bottom
        anchors.right: parent.right
        anchors.left: controlPanel.right
        height: main.height
    }
ControlView实现用于配置的按钮。ScopeView使用ChartView显示包含两个线系列图表
ChartView {
    id: chartView

    property bool openGL: openGLSupported

    animationOptions: ChartView.NoAnimation
    theme: ChartView.ChartThemeDark

    onOpenGLChanged: {
        if (openGLSupported) {
            var series1 = series("signal 1")
            if (series1)
                series1.useOpenGL = openGL;
            var series2 = series("signal 2")
            if (series2)
                series2.useOpenGL = openGL;
        }
    }

    ValueAxis {
        id: axisY1
        min: -1
        max: 4
    }

    ValueAxis {
        id: axisY2
        min: -10
        max: 5
    }

    ValueAxis {
        id: axisX
        min: 0
        max: 1024
    }

    LineSeries {
        id: lineSeries1
        name: "signal 1"
        axisX: axisX
        axisY: axisY1
        useOpenGL: chartView.openGL
    }
    LineSeries {
        id: lineSeries2
        name: "signal 2"
        axisX: axisX
        axisYRight: axisY2
        useOpenGL: chartView.openGL
    }
    ...
使用QML计时器更新线系列的数据。在现实生活应用程序中,更新操作可以由Qt C++代码的信号触发。
Timer {
    id: refreshTimer
    interval: 1 / 60 * 1000 // 60 Hz
    running: true
    repeat: true
    onTriggered: {
        dataSource.update(chartView.series(0));
        dataSource.update(chartView.series(1));
    }
}
示波器还允许您切换用于可视化信号源的系列类型。这是通过动态销毁和创建系列来实现的
function changeSeriesType(type) {
    chartView.removeAllSeries();

    // Create two new series of the correct type. Axis x is the same for both of the series,
    // but the series have their own y-axes to make it possible to control the y-offset
    // of the "signal sources".
    var series1
    var series2
    if (type === "line") {
        series1 = chartView.createSeries(ChartView.SeriesTypeLine, "signal 1",
                                         axisX, axisY1);
        series1.useOpenGL = chartView.openGL

        series2 = chartView.createSeries(ChartView.SeriesTypeLine, "signal 2",
                                         axisX, axisY2);
        series2.useOpenGL = chartView.openGL
    } else {
        series1 = chartView.createSeries(ChartView.SeriesTypeScatter, "signal 1",
                                         axisX, axisY1);
        series1.markerSize = 2;
        series1.borderColor = "transparent";
        series1.useOpenGL = chartView.openGL

        series2 = chartView.createSeries(ChartView.SeriesTypeScatter, "signal 2",
                                         axisX, axisY2);
        series2.markerSize = 2;
        series2.borderColor = "transparent";
        series2.useOpenGL = chartView.openGL
    }
}

function createAxis(min, max) {
    // The following creates a ValueAxis object that can be then set as a x or y axis for a series
    return Qt.createQmlObject("import QtQuick 2.0; import QtCharts 2.0; ValueAxis { min: "
                              + min + "; max: " + max + " }", chartView);
}
© 2024 The Qt Company Ltd. 本文档的贡献是相应所有者的版权。提供的文档是根据自由软件基金会发布的GNU自由文档许可证版本1.3的条款许可的。Qt及其相关标志是The Qt Company Ltd.在芬兰和其他国家的商标。所有其他商标均为其各自所有者的财产。
