散点系列 QML 类型
ScatterSeries 类型以散点图的形式展示数据。 更多...
| 导入语句 | import QtGraphs |
| 实例化 | QScatterSeries |
| 继承 | |
| 状态 | 技术预览 |
- 所有成员的列表,包括继承成员
- ScatterSeries 是 Qt Graphs 2D QML 类型 的一部分。
属性
- pointMarker : 组件
详细信息
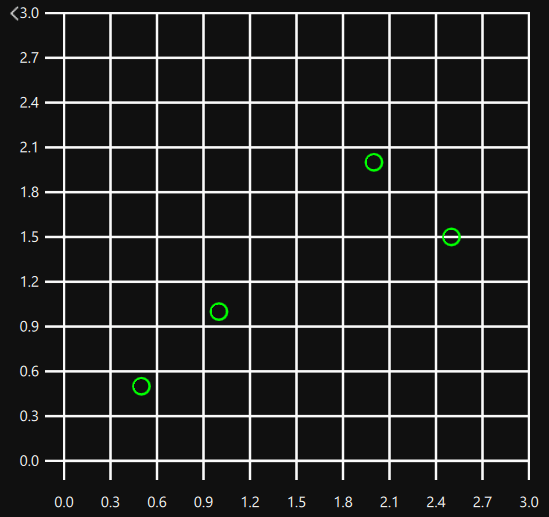
散点数据以图表上的点集合的形式显示。对于每个点,指定两个值以确定其在水平轴和垂直轴上的位置。

您可以通过在 GraphsView 内创建散点系列来表示散点数据。然后应使用 axisX 和 axisY 属性定义 ScatterSeries 的轴类型。最后,可以通过为 ScatterSeries 创建 XYPoints 作为子元素,并定义每个点的 x 和 y 值来向图表添加数据。
GraphsView {
    anchors.fill: parent
    ScatterSeries {
        color: "#00ff00"
        axisX: ValueAxis {
            max: 3
        }
        axisY: ValueAxis {
            max: 3
        }

        XYPoint { x: 0.5; y: 0.5 }
        XYPoint { x: 1; y: 1 }
        XYPoint { x: 2; y: 2 }
        XYPoint { x: 2.5; y: 1.5 }
    }
}
可以通过在 GraphsView 添加多个散点系列来创建多个散点图。在这种情况下,只有一个系列应定义使用的轴,因为多个定义将覆盖较早的定义。
GraphsView {
    anchors.fill: parent
    ScatterSeries {
        color: "#00ff00"
        axisX: ValueAxis {
            max: 3
        }
        axisY: ValueAxis {
            max: 3
        }

        XYPoint { x: 0.5; y: 0.5 }
        XYPoint { x: 1; y: 1 }
        XYPoint { x: 2; y: 2 }
        XYPoint { x: 2.5; y: 1.5 }
    }

    ScatterSeries {
        color: "#ff0000"
        XYPoint { x: 0.5; y: 3 }
        XYPoint { x: 1; y: 2 }
        XYPoint { x: 2; y: 2.5 }
        XYPoint { x: 2.5; y: 1 }
    }
}
属性文档
pointMarker : 组件 |
使用指定的 QML 组件标记点。
pointMarker: Image {
    source: "images/happy_box.png"
}
© 2024 Qt 公司。此处包含的文档贡献是各自所有者的版权。此处提供的文档根据 Free Software Foundation 发布的 GNU 自由文档许可证版本 1.3 的条款进行许可。Qt 和相关标志是芬兰和/或全球其他国家的 Qt 公司的商标。所有其他商标均为其各自所有者的财产。
