MapItemView 过渡效果 (QML)
如何一起使用过渡效果和 MapItemView。

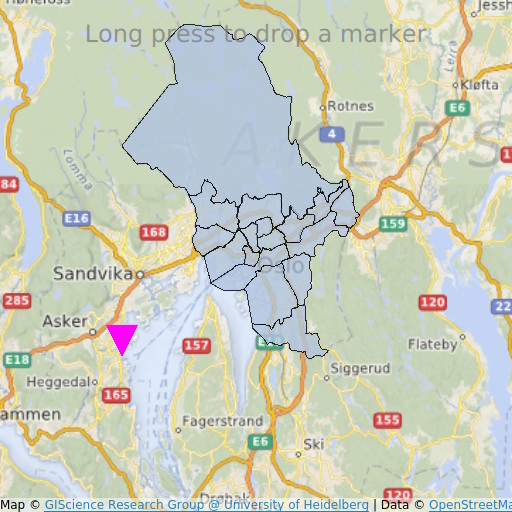
MapItemView 过渡效果 展示了如何使用 Map 元素来绘制地图。它显示了显示地图所需的最小代码量,可以用作进一步实验的基础。
运行示例
要从 Qt Creator 运行示例,打开 欢迎 模式并从 示例 中选择示例。更多信息,请访问 构建和运行示例。
QML 代码
在 main.qml 中,使用两个 MapItemView 元素,将奥斯陆地区的行政区域添加到地图中,并实现长按添加标志。
MapItemView {
    id: mivMarker

    add: Transition {
        NumberAnimation {
            property: "slideIn"
            from: 50
            to: 0
            duration: 500
            easing.type: Easing.OutBounce
            easing.amplitude: 3.0
        }
    }

    remove: Transition {
        NumberAnimation {
            property: "opacity"
            to: 0.1
            duration: 50
        }
    }

    model: ListModel {
        id: markerModel
    }
    delegate: Component {
        MapQuickItem {
            coordinate: QtPositioning.coordinate(latitude, longitude)
            anchorPoint: Qt.point(e1.width * 0.5, e1.height + slideIn)
            property real slideIn : 0
            sourceItem: Shape {
                id: e1
                vendorExtensionsEnabled: false
                width: 32
                height: 32
                visible: true

                transform: Scale {
                    origin.y: e1.height * 0.5
                    yScale: -1
                }

                ShapePath {
                    id: c_sp1
                    strokeWidth: -1
                    fillColor: Qt.rgba(1,0,1,1.0)

                    property real half: e1.width * 0.5
                    property real quarter: e1.width * 0.25
                    property point center: Qt.point(e1.x + e1.width * 0.5 , e1.y + e1.height * 0.5)

                    property point top: Qt.point(center.x, center.y - half )
                    property point bottomLeft: Qt.point(center.x - half, center.y + half )
                    property point bottomRight: Qt.point(center.x + half, center.y + half )

                    startX: center.x;
                    startY: center.y + half

                    PathLine { x: c_sp1.bottomLeft.x; y: c_sp1.bottomLeft.y }
                    PathLine { x: c_sp1.top.x; y: c_sp1.top.y }
                    PathLine { x: c_sp1.bottomRight.x; y: c_sp1.bottomRight.y }
                    PathLine { x: c_sp1.center.x; y: c_sp1.center.y + c_sp1.half }
                }
            }
        }
    }
}
标志视图指定了添加和移除过渡,以创建弹跳标志效果。
MapItemView {
    id: miv
    model: OsloListModel {
        id: osloListModel
    }
    add: Transition {
        NumberAnimation {
            property: "animationScale"
            from: 0.2
            to: 1
            duration: 800
            easing.type: Easing.OutCubic
        }
    }
    delegate: Component {
        MapPolygon {
            function fromMercator(l, centroid) {
                var res = []
                for (var i  = 0; i < l.length; i++) {
                    var vtx = l[i]
                    var offset = Qt.point((vtx.x - centroid.x) * animationScale,
                                          (vtx.y - centroid.y) * animationScale)
                    var pt = Qt.point(centroid.x + offset.x, centroid.y + offset.y)
                    res.push( QtPositioning.mercatorToCoord(pt) )
                }
                return res;
            }

            path: fromMercator(osloListModel.geometries[name+"_"+adminLevel]
                               , osloListModel.centroids[name+"_"+adminLevel] )
            color: ((adminLevel > 4) ? "lightsteelblue" : 'firebrick')
            property real animationScale : 1
            opacity: ((adminLevel < 9) ? 0.1 : 0.8)
            visible: true
        }
    }
}
行政区域视图仅指定了添加过渡,以创建区域增长效果。
需求
示例需要有效的互联网连接以下载 OpenStreetMap 地图瓦片。系统代理将被自动捕获。
© 2024 Qt 公司有限公司。此处包含的文档贡献的版权属于其各自的拥有者。此处提供的文档受 GNU 自由文档许可证版本 1.3 的条款约束,由自由软件基金会发布。Qt 及相关标志是芬兰的 Qt 公司及其在全世界范围内的商标。所有其他商标均为其各自所有者的财产。
