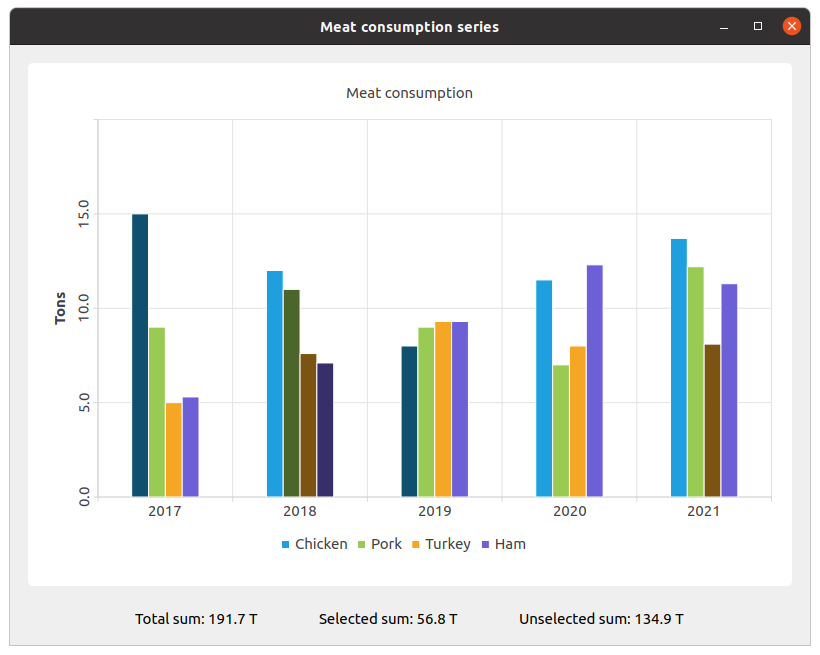
更改柱状图的颜色和状态
注意:这是带有小部件的图表画廊示例的一部分。
该示例演示了如何使用 setBarSelected() 函数更改柱状图的颜色和状态。

我们创建了集合,并向其中填充数据。然后,我们创建了一个数据系列并向其中添加数据。
QBarSet *setChicken = createChickenSet();
QBarSet *setPork = createPorkSet();
QBarSet *setTurkey = createTurkeySet();
QBarSet *setHam = createHamSet();
qreal totalSum = setChicken->sum() + setPork->sum() + setTurkey->sum() + setHam->sum();
QList<QBarSet *> setList = QList<QBarSet *>{setChicken, setPork, setTurkey, setHam};

auto series = new QBarSeries;
series->append(setList);
我们创建了图表,并向其中添加了系列。此外,我们还为图表添加了标题,设置了对图表的动画,并对图例进行了对齐。
auto chart = new QChart;
chart->addSeries(series);
chart->setTitle(tr("Meat Consumption (Click on bars to select them)"));
chart->setAnimationOptions(QChart::SeriesAnimations);
chart->legend()->setVisible(true);
chart->legend()->setAlignment(Qt::AlignBottom);
chart->layout()->setContentsMargins(0, 0, 0, 0);
这里我们设置了所选柱状图的颜色。
const auto barSets = series->barSets();
for (QBarSet *barSet : barSets)
    barSet->setSelectedColor(barSet->brush().color().darker());
下一步是添加轴:QBarCategoryAxis 用于测量年份数据和 QValueAxis 用于值范围。
QStringList categories = createYearCategories();
auto axisX = new QBarCategoryAxis;
axisX->setCategories(categories);
chart->addAxis(axisX, Qt::AlignBottom);
series->attachAxis(axisX);

auto axisY = new QValueAxis;
axisY->setRange(0, 20);
axisY->setTitleText(tr("Tons"));
axisY->setLabelsAngle(-90);
axisY->setTitleVisible(true);
chart->addAxis(axisY, Qt::AlignLeft);
series->attachAxis(axisY);
然后我们将图表视图添加进去。
auto chartView = new QChartView(chart, this);
chartView->setRenderHint(QPainter::Antialiasing);
这里我们创建了一个小部件来显示所选和未选柱状图的价值标签。
auto labelWidget = new QWidget(this);
auto labelLayout = new QHBoxLayout(labelWidget);
labelLayout->setAlignment(Qt::AlignCenter);

auto totalSumLabel = new QLabel(tr("Total sum: %1 T").arg(totalSum), this);
labelLayout->addWidget(totalSumLabel);
totalSumLabel->setContentsMargins(0, 0, 54, 0);

auto selectedSumLabel = new QLabel(tr("Selected sum: 0 T"), this);
labelLayout->addWidget(selectedSumLabel);

auto unselectedSumLabel = new QLabel(tr("Unselected sum: %1 T").arg(totalSum), this);
labelLayout->addWidget(unselectedSumLabel);
unselectedSumLabel->setContentsMargins(54, 0, 0, 0);
我们使用 lambda 将特定柱状图的选中操作与价值标签连接起来。set->toggleSelection({index}) 设置了柱状图的选中状态。
QObject::connect(series, &QAbstractBarSeries::clicked, series, [=](int index, QBarSet *set) {
    set->toggleSelection({index});
    qreal selectedSum = 0.;
    for (int i = 0; i < setList.size(); ++i) {
        auto selectedIndices = setList.at(i)->selectedBars();
        for (int k = 0; k < selectedIndices.size(); ++k)
            selectedSum += setList.at(i)->at(selectedIndices.at(k));
    }
    selectedSumLabel->setText(tr("Selected sum: %1 T").arg(selectedSum));
    // Because of rounding errors, selectedSum can result in being bigger than total sum
    qreal unselectedSum = totalSum - selectedSum < 0 ? 0. : totalSum - selectedSum;
    unselectedSumLabel->setText(
        tr("Unselected sum: %1 T")
            .arg(unselectedSum)
        );
});
最后,我们创建了主布局。
auto mainLayout = new QVBoxLayout(this);

mainLayout->addWidget(chartView);
mainLayout->addWidget(labelWidget);
© 2024 Qt 公司有限。本文件中的文档贡献属于各自的版权所有者。本文件中的文档根据自由软件基金会的GNU 自由文档许可协议版本 1.3 许可。Qt 和相应的标志是芬兰及/或全世界 The Qt Company Ltd 的商标。所有其他商标属于其各自的所有者。
