使用主题创建图表
注意: 这部分是 带有小部件的图表库示例 的一部分。
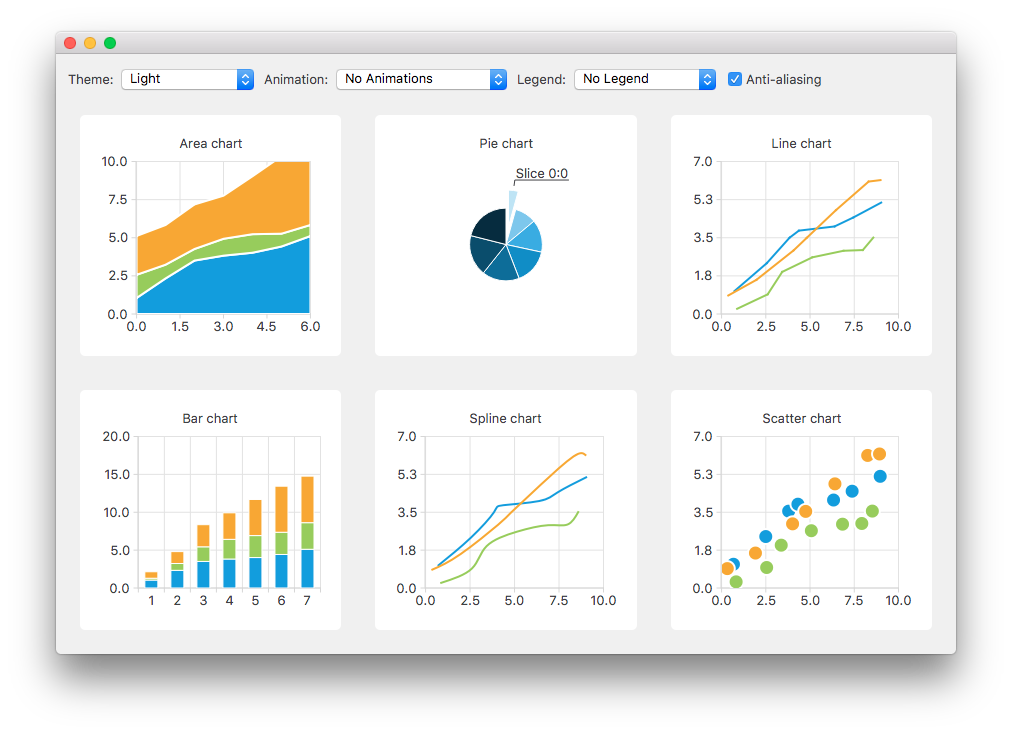
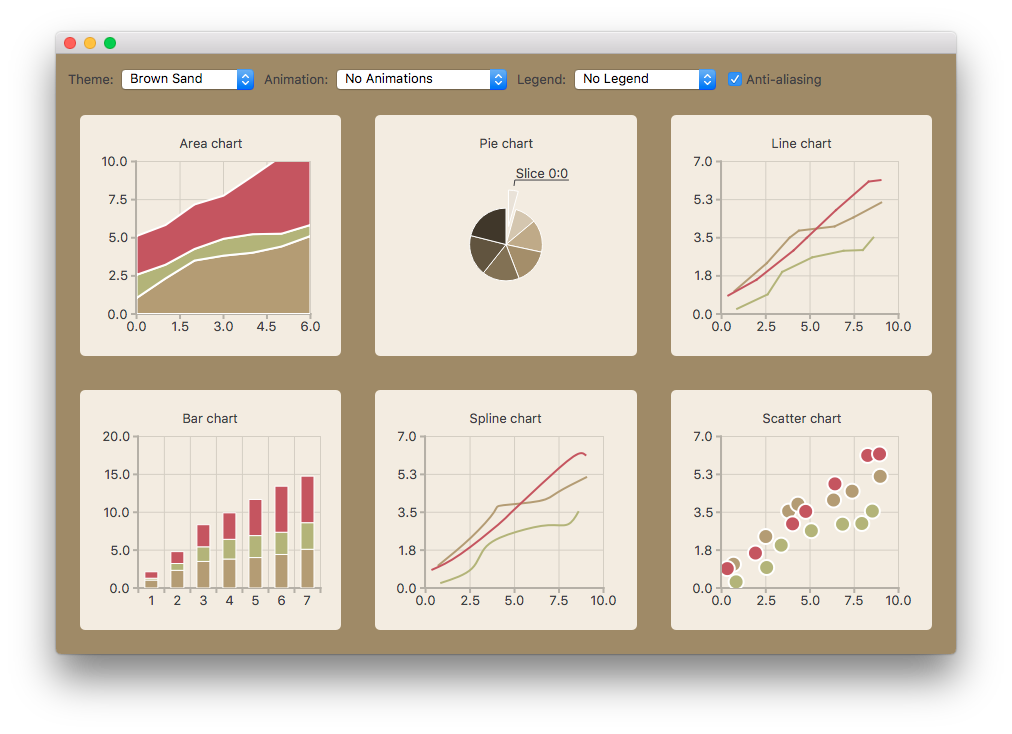
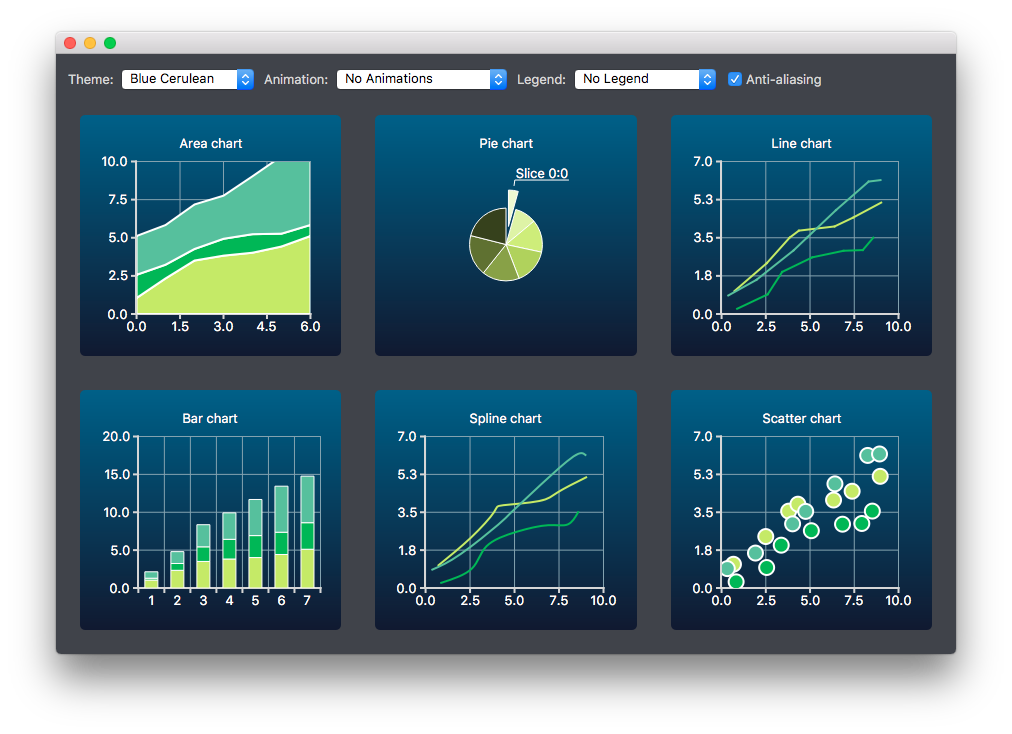
在这里,可以更改某些受支持的图表类型内置主题的外观和感觉。


创建图表
不同类型的图表分别生成并添加到布局中。例如,创建折线图如下。其他图表类型的创建方式类似。
首先创建一个图表。
auto chart = new QChart;
chart->setTitle("Line Chart");
生成一组常见的随机数据并将其放置在列表中。这个列表用于每个图表类型向图表的系列中添加数据。对于线条系列,创建并添加到图表的 QLineSeries 实例。
QString name("Series ");
int nameIndex = 0;
for (const DataList &list : m_dataTable) {
    auto series = new QLineSeries(chart);
    for (const Data &data : list)
        series->append(data.first);
    series->setName(name + QString::number(nameIndex));
    nameIndex++;
    chart->addSeries(series);
}
为线条系列创建默认轴。我们还根据系列使用的数据的范围指定轴的范围。
chart->createDefaultAxes();
chart->axes(Qt::Horizontal).first()->setRange(0, m_valueMax);
chart->axes(Qt::Vertical).first()->setRange(0, m_valueCount);
我们还想在标签和 Y 轴之间添加更多空间。为此,我们指定一个在标签中添加空格字符的标签格式。
// Add space to label to add space between labels and axis
auto axisY = qobject_cast<QValueAxis *>(chart->axes(Qt::Vertical).first());
Q_ASSERT(axisY);
axisY->setLabelFormat("%.1f  ");
最后将折线图添加到网格布局中。
chartView = new QChartView(createLineChart(), this);
m_ui->gridLayout->addWidget(chartView, 1, 2);
更改主题
用户可以选择用于示例的内置主题。然后,将此主题应用于布局中的所有图表。
auto theme = static_cast<QChart::ChartTheme>(
            m_ui->themeComboBox->itemData(m_ui->themeComboBox->currentIndex()).toInt());
    ...
chartView->chart()->setTheme(theme);
更改动画、图例和反走样
在此示例中,还可以看到更改动画、图例和反走样如何影响图表的外观。
根据用户选择,在每次图表上设置使用的动画类型。图表中可以没有动画,或者只有网格轴或系列动画,或者两者都有。
QChart::AnimationOptions options(
            m_ui->animatedComboBox->itemData(m_ui->animatedComboBox->currentIndex()).toInt());
if (!m_charts.isEmpty() && m_charts.at(0)->chart()->animationOptions() != options) {
    for (QChartView *chartView : charts)
        chartView->chart()->setAnimationOptions(options);
}
图表可以显示图例。图例可以沿着图表的不同侧面对齐。
Qt::Alignment alignment(
            m_ui->legendComboBox->itemData(m_ui->legendComboBox->currentIndex()).toInt());

if (!alignment) {
    for (QChartView *chartView : charts)
        chartView->chart()->legend()->hide();
} else {
    for (QChartView *chartView : charts) {
        chartView->chart()->legend()->setAlignment(alignment);
        chartView->chart()->legend()->show();
    }
}
用户还可以看到如何更改反走样选项改变图表的外观。反走样根据用户选择更新。
bool checked = m_ui->antialiasCheckBox->isChecked();
for (QChartView *chart : charts)
    chart->setRenderHint(QPainter::Antialiasing, checked);
© 2024 The Qt Company Ltd. 此处包含的文档贡献的版权属于其各自的版权所有者。此处提供的文档根据自由软件基金会发布的 GNU 自由文档许可证版本 1.3 的条款授权。Qt 和相应的标志是 The Qt Company Ltd. 在芬兰和其他国家/地区的商标。所有其他商标均属于其各自所有者。
