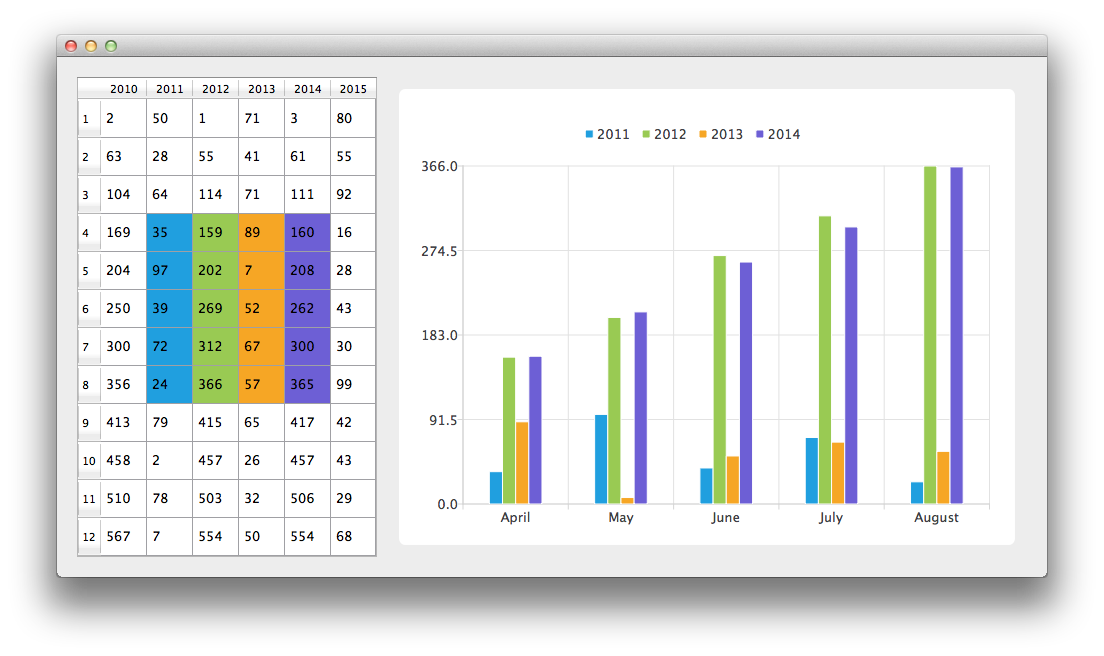
使用柱状图数据模型
注意:这是 图表工具栏示例 的一部分。

首先,创建一个 CustomTableModel 类的实例。CustomTableModel 类由 QAbstractTableModel 派生而来,并为本例创建。该类的构造函数用于填充模型内部数据存储,为我们的图表示例提供所需的数据。
auto model = new BarModelMapperModel(this);
现在我们有一个包含我们要在图表和 QTableView 上显示的数据的模型。首先创建 QTableView,并告诉其使用模型作为数据源。为了以美观的方式呈现数据,设置了表格视图的最小宽度,并将其标题的调整模式改为拉伸。
// create table view and add model to it
auto tableView = new QTableView(this);
tableView->setModel(model);
tableView->setMinimumWidth(300);
tableView->horizontalHeader()->setSectionResizeMode(QHeaderView::Stretch);
tableView->verticalHeader()->setSectionResizeMode(QHeaderView::Stretch);
model->setParent(tableView);
现在需要一个 QChart 实例来在图表上显示相同的数据。我们还启用了动画,这使得更容易看到对模型数据的修改如何影响图表。
以下代码的第一行创建一个新的柱状图序列。变量 firstRow 和 rowCount 用于定义自定义模型映射。自定义映射允许只从模型中获取部分数据。在此情况下,从索引为 3 的行开始的 5 行数据。以下三行创建 QVBarModelMapper 类的一个实例,并指定应该从模型的索引为 1 到 4(包含)的列中取数据。为了在序列和模型之间建立连接,我们将这两个对象都设置为 QVBarModelMapper。
最后,将序列添加到图表中。
auto series = new QBarSeries;

int first = 3;
int count = 5;
auto mapper = new QVBarModelMapper(this);
mapper->setFirstBarSetColumn(1);
mapper->setLastBarSetColumn(4);
mapper->setFirstRow(first);
mapper->setRowCount(count);
mapper->setSeries(series);
mapper->setModel(model);
chart->addSeries(series);
为了在 QTableView 中显示哪些数据对应哪些柱状图集合,本例使用表格着色。当序列被添加到图表中时,它将根据当前选定的主题分配一种颜色。下面的代码从序列中提取该颜色,并使用它创建着色的 QTableView。视图着色不是 QChart 功能的一部分。
// for storing color hex from the series
QString seriesColorHex = "#000000";

// get the color of the series and use it for showing the mapped area
QList<QBarSet *> barsets = series->barSets();
for (int i = 0; i < barsets.count(); i++) {
    seriesColorHex = "#" + QString::number(barsets.at(i)->brush().color().rgb(), 16).right(6).toUpper();
    model->addMapping(seriesColorHex, QRect(1 + i, first, 1, barsets.at(i)->count()));
}
我们希望在图表的轴上放置描述数据含义的类别。以下代码片段展示了如何做到这一点。
QStringList categories {"April",  "May", "June", "July", "August"};
auto axisX = new QBarCategoryAxis;
axisX->append(categories);
chart->addAxis(axisX, Qt::AlignBottom);
series->attachAxis(axisX);
auto axisY = new QValueAxis;
chart->addAxis(axisY, Qt::AlignLeft);
series->attachAxis(axisY);
为了避免设置 QGraphicsScene,我们使用 QChartView 类,它会为我们完成这项工作。将 QChart 对象指针用作 QChartView 构造函数的参数。为了使渲染看起来更好,启用了抗锯齿,并设置了图表视图小部件的最小大小。
auto chartView = new QChartView(chart, this);
chartView->setRenderHint(QPainter::Antialiasing);
最后,我们将两个小部件放置在布局中,并使用该布局作为应用程序布局。
// create main layout
auto mainLayout = new QGridLayout;
mainLayout->setHorizontalSpacing(10);
mainLayout->addWidget(tableView, 1, 0);
mainLayout->addWidget(chartView, 1, 1);
mainLayout->setColumnStretch(1, 1);
mainLayout->setColumnStretch(0, 0);
setLayout(mainLayout);
应用程序已 ready。尝试修改表格视图中的数据,看看它如何影响图表。
